What your readers can do with it
The 3D graphing calculator draws in a box that turns when you drag it, zooms with a scroll or a pinch, and snaps to Top, Front and Side views. It reads the forms a Calc 3, vector calculus or physics course uses:
- surfaces such as
z = x^2 - y^2, and planes such asz = 3 - x - y; - implicit surfaces such as
x^2 + y^2 + z^2 = 9; - space curves like a helix, and parametric surfaces like a torus;
- cylindrical and spherical equations, using
r,theta,rhoandphi; - vector fields, drawn as arrows coloured by magnitude.
The View menu adds contour lines, colour by height and opacity, which helps when you want students to connect a surface with its level curves.
Where it fits
Put a widget beside each figure in your notes on quadric surfaces, saddle points or surfaces of revolution. Readers turn the saddle until they see why the origin is a maximum along one direction and a minimum along the other, which a printed figure rarely shows. It draws with WebGL and runs in any current mobile browser, so it works on the phones most students read on.
Suggested size
The default frame is 600 px high and up to 1,100 px wide. In a column wider than about 860 px the expression list sits beside the 3D box. In a narrower column, and on phones, the list moves under the box, so a height of about 750 px shows both; keep 600 px if the graph alone is what matters, since readers can still scroll to the list inside the frame.
Open it on a sphere cut by a plane
The graph is stored after #e= in the address. This link draws the sphere x² + y² + z² = 16 and the plane z = 2:
https://widemath.com/embed/3d-graphing-calculator/#e=eyJ2IjoxLCJlIjpbInheMiArIHleMiArIHpeMiA9IDE2IiwieiA9IDIiXSwiZCI6MH0
The plane slices the sphere in a circle. A good question to put under it: setting z = 2 leaves x² + y² = 12, so what is the radius of that circle? (It is √12, about 3.46.) To share your own graph, draw it on the full 3D page, press Share and add /embed after widemath.com in the copied address.
Add it in three steps
- Load your graph, pick the height for your column, and press Copy embed code.
- Paste it into an HTML block: Custom HTML in WordPress, the HTML editor in Canvas, or Embed code in Google Sites.
- Add a line telling readers to drag the box, since many will not expect a figure to move.
Frequently asked questions
Does the 3D widget work on phones?
Yes. It draws with WebGL, which every current mobile browser supports. Readers rotate with one finger and zoom with a pinch.
Can I set the axis ranges for my readers?
A link from the Share button on the full page stores the expressions, the angle unit and the view box, so the widget opens with the ranges you chose.
Can it plot a vector field?
Yes. Type a field in angle brackets, such as <-y, x, 1>, and it draws arrows coloured by their length.
More calculator widgets
Want the explanations and worked examples as well? They are on the full 3D Graphing Calculator page. All 24 widgets, each with a Copy code button, are in the calculator widget gallery.
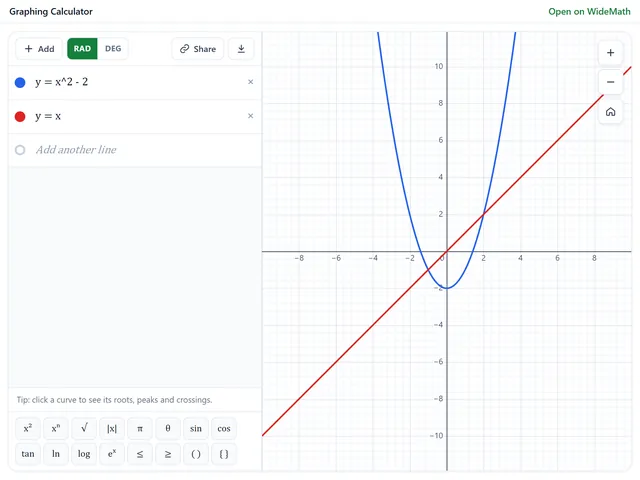
Graphing Calculator
Plot functions, inequalities, polar curves and sliders, and open your own graph from a link.
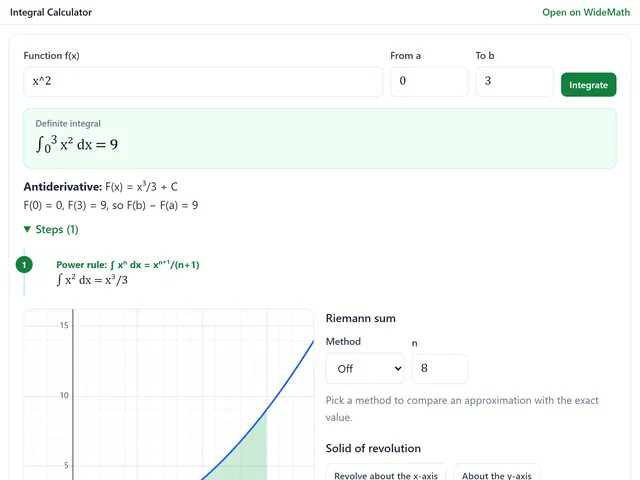
Integral Calculator
Definite integrals with the area shaded, Riemann sums and volumes of revolution in 3D.
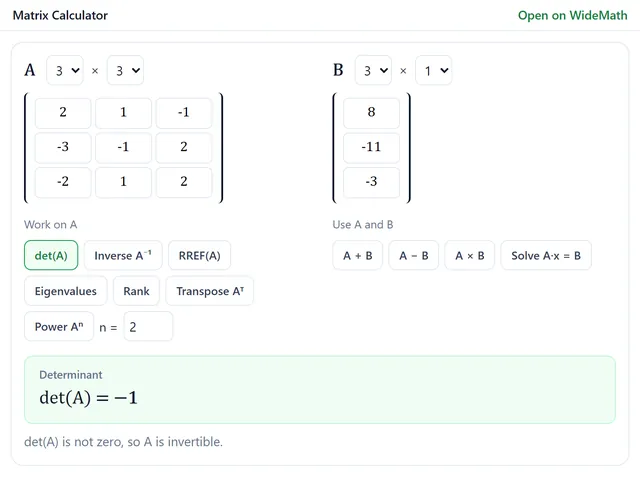
Matrix Calculator
Exact-fraction determinants, inverses, RREF and eigenvalues up to 6 × 6, with every row operation.