What your readers can do with it
A static picture of a parabola answers one question. A graph that readers can change answers the next five. The WideMath graphing calculator redraws as they type, and it handles most of what a school or first-year course meets:
- functions such as
y = x^2 - 4, implicit curves such asx^2 + y^2 = 25, and inequalities with shaded regions; - polar curves like
r = 1 + cos(θ), parametric curves, points and limited domains; - sliders: type
a = 2and useain another line, then drag it to watch the graph move; - slope fields and vector fields for a differential equations unit.
Clicking a curve marks its roots, turning points, y-intercept and crossings with other curves, with coordinates on hover. That turns "where do these meet?" into something a student can check rather than take on trust.
Where it fits
Use it in a lesson on solving equations graphically, in a post about transformations of functions (a slider for each transformation works well), or on a linear programming worksheet where the shaded feasible region does the explaining. Because the graph opens from a link, one page can hold several widgets, each showing a different example.
Suggested size
The default frame is 600 px high and up to 1,100 px wide. On a content column wider than about 860 px the expression list sits beside the graph and everything fits. In a narrower column, and on phones, the list moves under the graph, so raise the height to about 800 px if you want readers to see both without scrolling inside the frame.
Open the widget on your own graph
The graph lives in the part of the address after #e=. This link draws y = x² − 4x + 3 and the line y = x − 1:
https://widemath.com/embed/graphing-calculator/#e=eyJ2IjoxLCJlIjpbInkgPSB4XjIgLSA0eCArIDMiLCJ5ID0geCAtIDEiXSwiZCI6MH0
Ask readers to click the parabola: the crossings appear at (1, 0) and (4, 3), the two solutions of x² − 4x + 3 = x − 1. To make a link for your own graph, draw it on the full graphing calculator, press Share, and put /embed after widemath.com in the address it copies.
Add it in three steps
- Load your graph into the preview (or keep the default parabola and line), then press Copy embed code.
- Paste it into the page: a Custom HTML block in WordPress, Insert, Embed in Google Sites, or the HTML view of a Moodle page.
- Write one question under the widget, such as "Where do the two graphs meet?", so readers know what to try.
Frequently asked questions
Can students change the graph inside the widget?
Yes. They can edit or add expressions, drag the view, zoom, switch between radians and degrees and save a PNG. Their changes stay in their own browser and never alter the graph on your page.
How do I put several different graphs on one page?
Paste the code once for each graph and give every copy its own #e= link from the Share button. Each frame loads its own graph.
Does it work with degrees for trig graphs?
Yes. The RAD and DEG switch sits above the expression list, and a shared link remembers which one you picked.
Is there a 3D version?
Yes. The 3D graphing calculator widget plots surfaces and space curves in a box readers can rotate.
More calculator widgets
Want the explanations and worked examples as well? They are on the full Graphing Calculator page. All 24 widgets, each with a Copy code button, are in the calculator widget gallery.
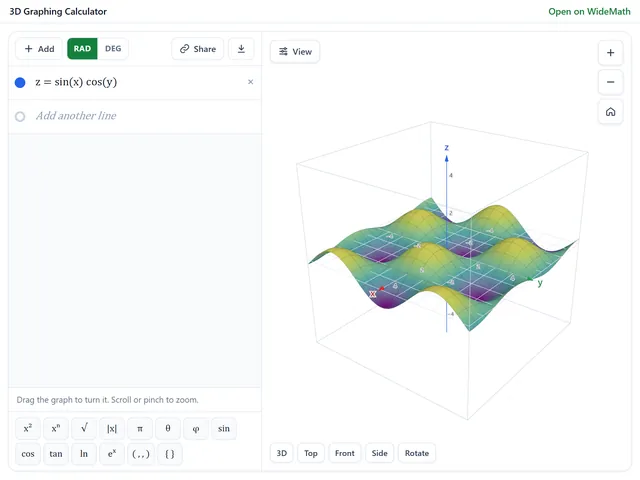
3D Graphing Calculator
Surfaces, space curves and vector fields in a 3D box readers can rotate and zoom.
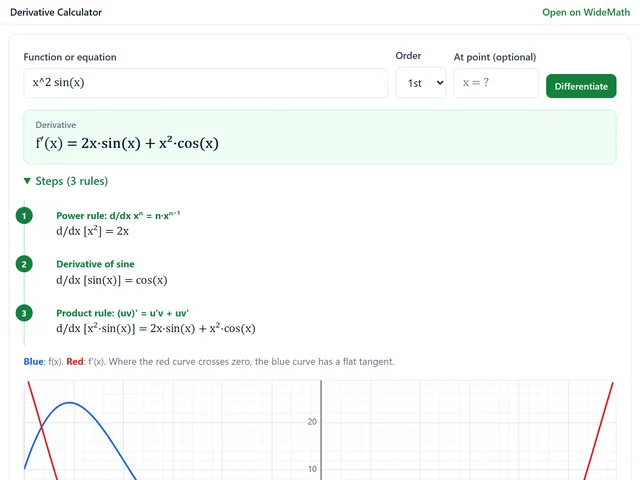
Derivative Calculator
Derivatives with every rule named, higher orders, partials, implicit dy/dx and tangent lines.
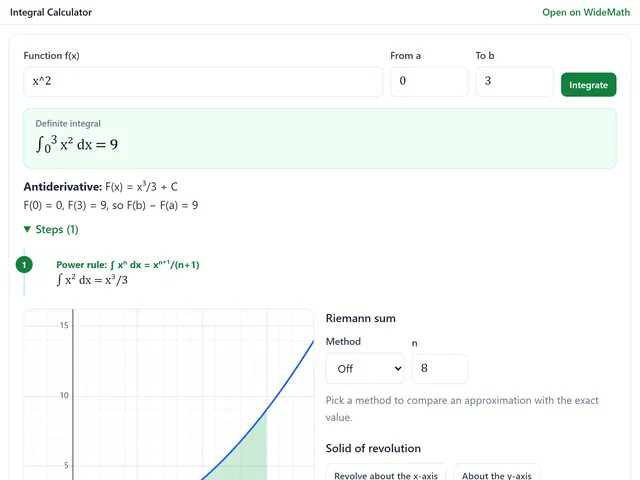
Integral Calculator
Definite integrals with the area shaded, Riemann sums and volumes of revolution in 3D.