What your readers can do with it
"How many people do I need?" is the first question in almost every student research project, and the answer depends on the design. The sample size calculator has a tab for each common case:
- Survey: Cochran's formula for estimating a percentage, with the population size, the expected response rate and Slovin's formula for comparison.
- Means: two groups, paired or one sample, from Cohen's d or from means and SDs.
- Proportions for comparing two rates, and ANOVA, r, χ² for three or more groups, a correlation or a contingency table.
- Power: the power of a sample you already have, with a power curve, and an Effect size tab that converts between d, r, f, η², odds ratios and w.
Every answer comes with the working and a sentence for the methods section, such as "A sample of 128 participants (64 per group) gives 80% power to detect an effect of d = 0.5". The t-tests, ANOVA, correlation and chi-square use the same exact distributions as G*Power 3.1.
Where it fits
A research methods module can embed it in the week on planning a study, with one scenario per tab for students to work through. Supervisors can put it on a thesis guidance page, and a survey platform's help centre can use the Survey tab to answer the question its customers ask most.
Suggested size
The default frame is 1,130 px high and up to 960 px wide, which fits the tabs, the inputs, the result, the methods sentence and the top of the working. On a phone the tool is about 1,590 px tall and scrolls inside the frame. The Power tab adds a chart, so give it 1,300 px if that tab is the point of your page.
Open it on a two-group t-test
The address carries the whole calculation. This link plans a two-group comparison for a medium effect, d = 0.5, at α = 0.05 and 80% power:
https://widemath.com/embed/sample-size-calculator/?tab=means&d=0.5&alpha=0.05&power=0.8
The widget answers 64 per group, 128 in total, with an actual power of 0.8015. It also shows the normal approximation, 62.79 per group, and explains that the exact t-test needs 64. For a survey of a known population, try ?tab=survey&moe=5&pop=2000.
Add it in three steps
- Load the calculation that matches your lesson, then press Copy embed code.
- Paste it into the module page in Canvas, Moodle or Blackboard, or a Custom HTML block on a blog.
- Ask students to justify their effect size in a sentence before they read the answer.
Frequently asked questions
Does it match G*Power?
For t-tests, ANOVA, correlation and chi-square, yes: it uses the same exact noncentral distributions as G*Power 3.1, so a two-group t-test with d = 0.5, α = 0.05 and 80% power gives 64 per group in both.
What sample size does a survey need?
At 95% confidence, a 5% margin of error and an expected proportion of 50%, Cochran's formula gives 385 respondents for a large population. A smaller known population, or a response rate below 100%, changes that, and the Survey tab handles both.
Where does the effect size come from?
From earlier studies, a pilot, or the smallest effect that would matter in practice. The widget cannot choose it for you, and the note at its foot says so: the answer is only as good as the effect size you assume.
More calculator widgets
Want the explanations and worked examples as well? They are on the full Sample Size Calculator page. All 24 widgets, each with a Copy code button, are in the calculator widget gallery.
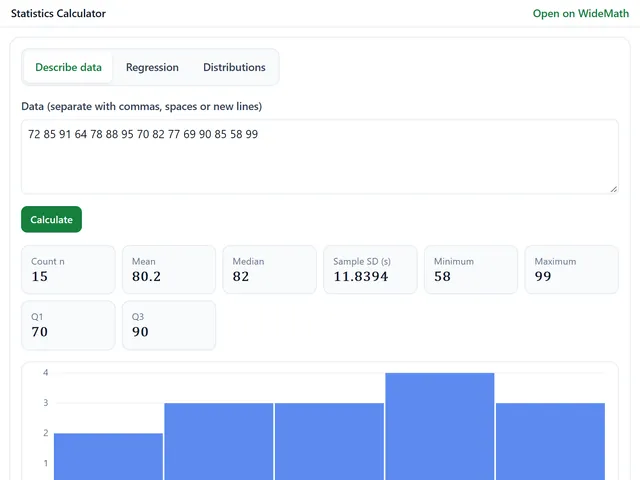
Statistics Calculator
Mean, SD, quartiles, regression with R², and normal, t, chi-square and F probabilities.
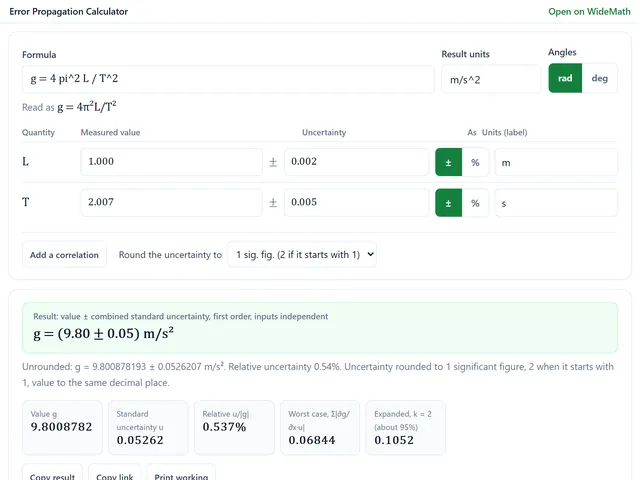
Error Propagation Calculator
Uncertainty of any formula, with the partial derivatives, each input's share and a Monte Carlo check.
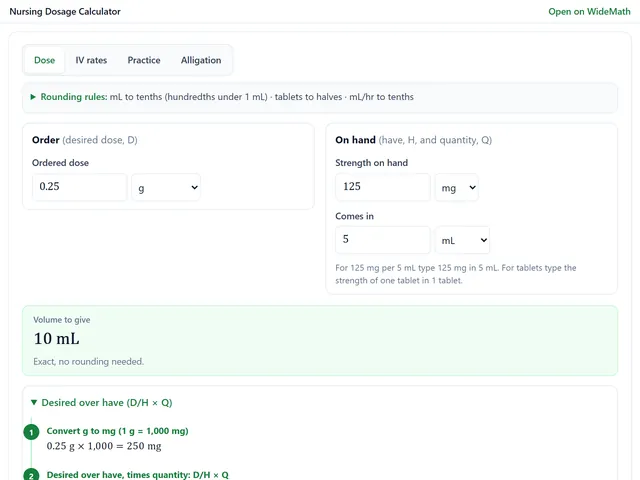
Nursing Dosage Calculator
Dosage calculations worked three ways, IV drip and infusion rates, practice problems, alligation.